Over 200,000 New Daily Live Home Sleep Recordings With 5-Years Of History & 250+ Million Nights Of Sleep, Including Two Sleepers
Recorded with high fidelity, analyzed, and processed by our sleep experts using AI and machine learning; our tools analyze differences and changes over time in detailed sleep patterns day-after-day and includes the impact of two sleepers with one another.Clinically Validated Sleep Intelligence at Scale
Independently vetted by Stanford Medicine and UCSF, Sleeptracker-AI is a SaaS platform for sleep medicine, remote patient monitoring, and clinical trials—combining massive real-world longitudinal data with advanced Fullpower-AI analytics built for clinical research at scale.
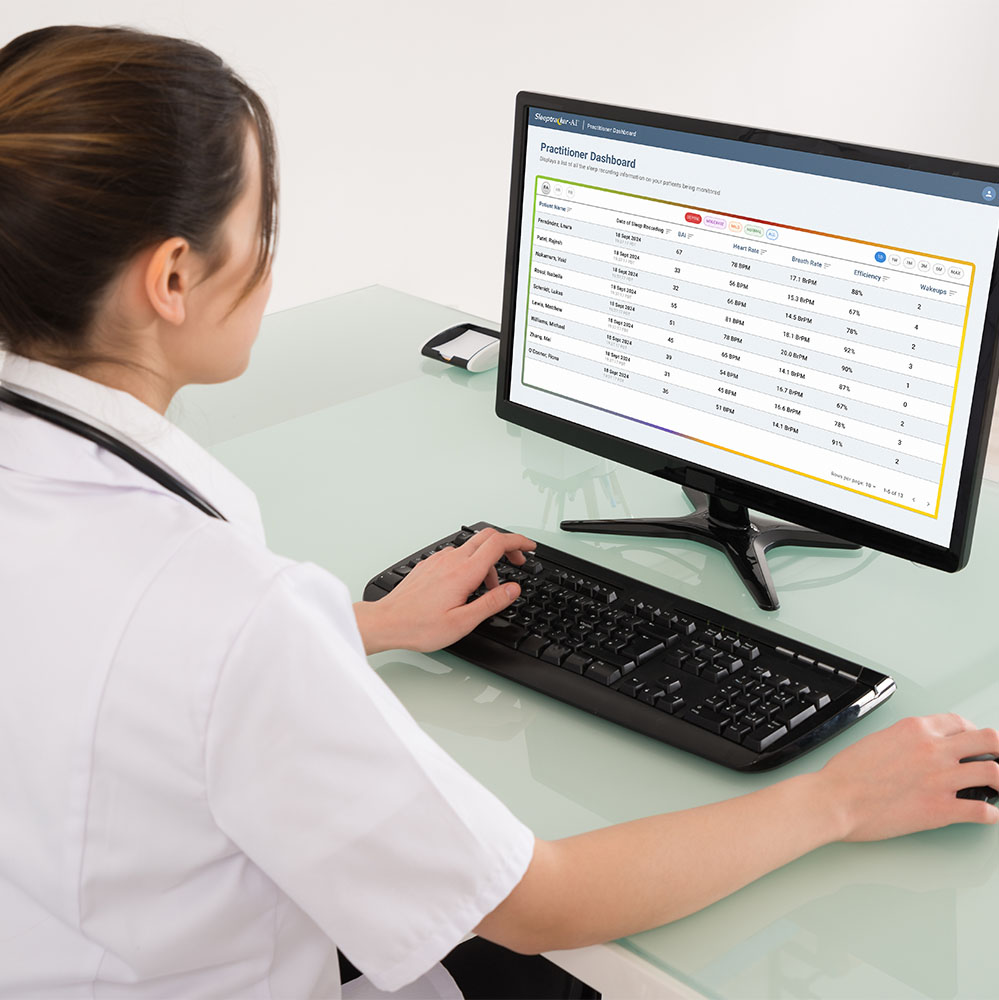
No-code Automatic Clinical Summaries and Practitioner's Dashboard
Real-time patient dashboard for practitioners and clinical trials with no-code and API configuration options, designed to run on tablets, smartphones, and desktops

Real-Time Biosensing
Real-time data aggregation and analysis for all popular wearables and contactless sensors, delivering continuous monitoringReal-Time API
Real-time cloud-to-cloud API for seamless integration with alerts and notificationsRPM KOA Agent
By applying advanced data science, predictive AI, and specialized large action-focused generative AI, the Koa agent aggregates diverse streams of data into precise, actionable intelligence, and automatic clinical summaries.
By applying advanced data science, predictive AI, and specialized large action-focused generative AI, the Koa agent aggregates diverse streams of data into precise, actionable intelligence, and automatic clinical summaries.
1,500,000+
Biosensing-Connected AI-Powered Devices
120,000+
Biosensing-Connected AI-Powered FDA Cleared
60+ Countries
Compliant, Vetted, and Deployed
Stanford + UCSF
Validation & Collaboration
70+
Research Studies
10+
Publications
50+
Scientists & Technologists
100+
Patents
15+ Years
Successful Business
Sensing is Real-time, contactless, & non-invasive monitoring
Dataset Access: Real-Time API and No-Code RPM Dashboard
Our Platform Delivers:
- AI-driven Sleep Optimization
- Closed-Loop Environmental Control
- Continuous Biosensing
- Personalized Interventions
- Longitudinal Health Intelligence
Platform Insights and Resources
Clinical Validations
 View Clinical Validations
Sleeptracker-AI® research is now validated by Stanford University, Division of Sleep Medicine.
Sleep research, science, and medicine are our focus. We support three successful business models: CRO, B2B Licensing, and PaaS.
Key Features & Capabilities
Fullpower-AI® is the leading AI-biosensing platform powering the next generation of sleep, health, and clinical intelligence at scale. Its flagship Sleeptracker-AI® Monitor is a contactless, continuous vital-parameter monitoring platform that tracks cardiac, respiratory, sleep, and movement biomarkers without wearables or direct body contact.
Contactless Dual Monitoring
Small, passive piezo sensors placed under the mattress seamlessly and accurately monitor two sleepers in the same bed.Advanced Biosensing
The platform leverages ballistocardiography and proprietary KOA AI models to capture micro-vibrations from cardiac contractions, respiratory activity, upper-airway events, and body movement.Clinical-Grade Fidelity
Sleeptracker-AI® delivers real-time Heart Rate, Respiratory Rate, apnea-related signals, sleep metrics, and movement insights with high fidelity, validated through research collaborations with Stanford Medicine and UCSF.

Seamless Integration
Data is securely accessible through a web dashboard, mobile app, and real-time API, enabling integration with clinical, research, senior-living, and enterprise systems.Global Deployment
Fullpower-AI® technology is vetted and deployed in 140 countries, supporting large-scale, real-world use across consumer, clinical, and enterprise environments.Real-Time Sense and Respond
Powered by the KOA Large Action Model (LAM), the platform can transform continuous biosensing data into actionable insights, alerts, and intelligent interventions.
Unmatched Data Scale
The platform is powered by one of the largest high-fidelity sleep datasets in the world, including more than 2 billion hours of sleep data.Introducing KOA: The Knowledge Organizational
Architecture Large Action Model (LAM)
Fullpower-AI's KOA LAM is setting a new benchmark for real-world health intelligence, transforming how we understand and manage health—anytime, anywhere.
Why KOA LAM?
1. Real-World Data
- Unmatched Scale: Built on 2+ billion biosensing datapoints from users in 140+ countries—and growing daily.
- Comprehensive Analysis: Pairs physiology (heart rate, breathing, motion) with environmental context (temperature, air quality, humidity).
- IoT Management: Orchestrates fleets of commercial biosensors with zero-touch management.
2. Clinically Validated by Leading Experts
- Trusted Accuracy: KOA LAM's insights are clinically validated by top institutions, including Stanford Medicine and UCSF.
- Global Recognition: Findings presented at SLEEP 2024, Sleep Europe 2024, and other international forums.
- Science-Backed Credibility: Trusted daily by physicians and research teams worldwide.
3. Real-Time Intelligence
- Sense-and-Response: Detects physiological events in real-time and triggers personalized responses.
- Real-Time orchestrated intelligence.
- Continuous Monitoring: Tracks long-term trends critical to cognitive, metabolic, and cardiovascular health.
4. Transforming Medicine & Biosensing
- Continuous, Non-Invasive biosensing: Moves beyond the lab—scaling science into daily life enabling preventative medicine and next-generation research.
- Actionable Insights: Supports longevity, preventive care, and early intervention.
Partner with Fullpower-AI
Bring KOA's real-time biosensing intelligence to your patients, customers, or team. Let's build the next generation of health together.
Example of practical KOA LAM implementation
in sleep science and smart beds:
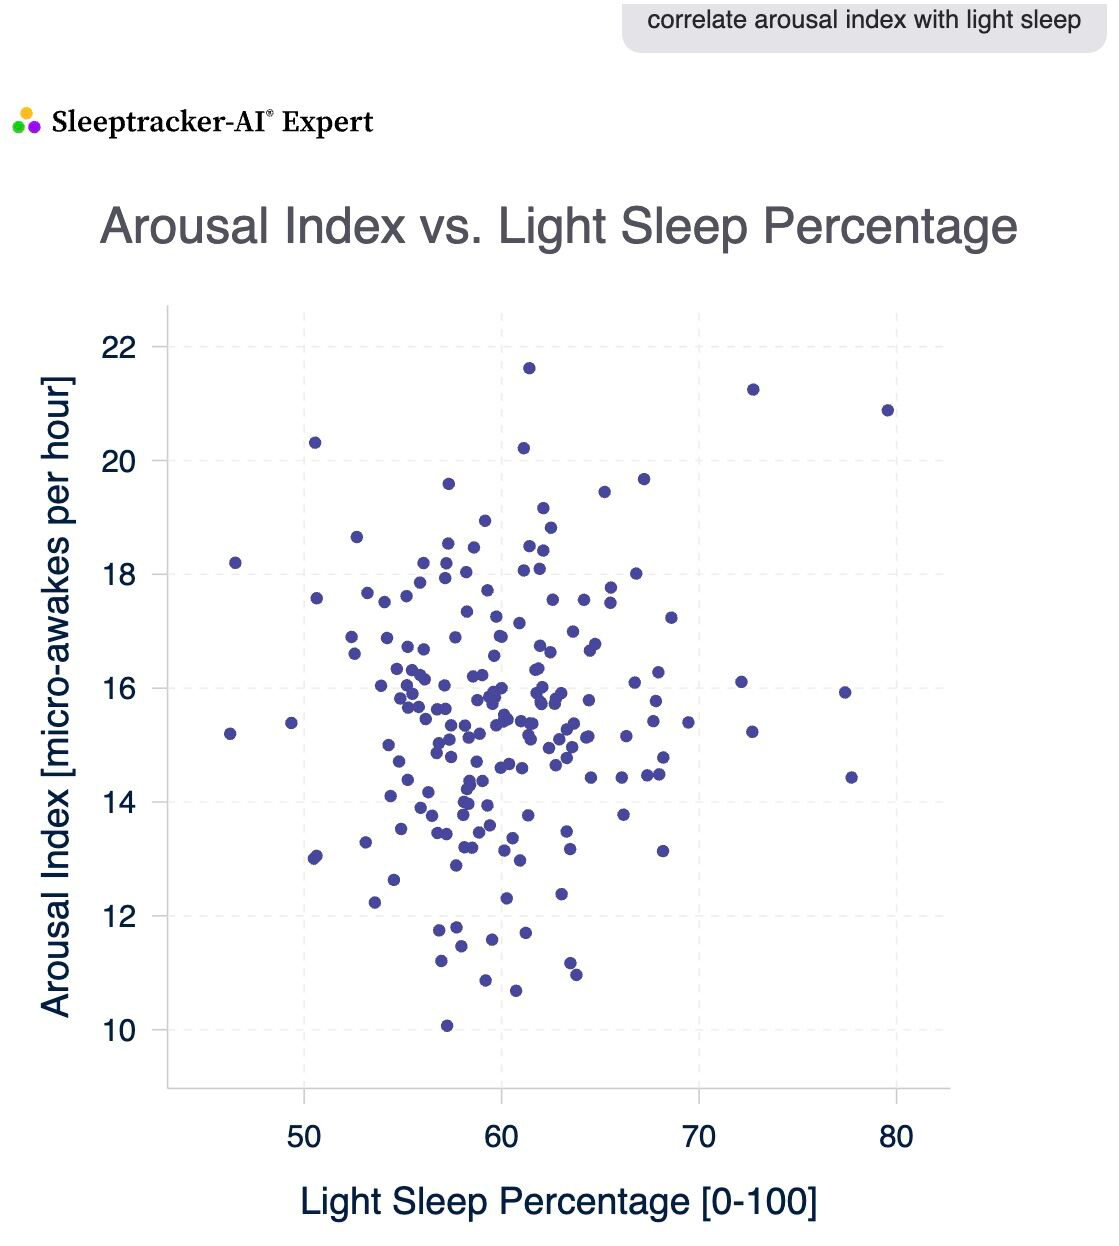
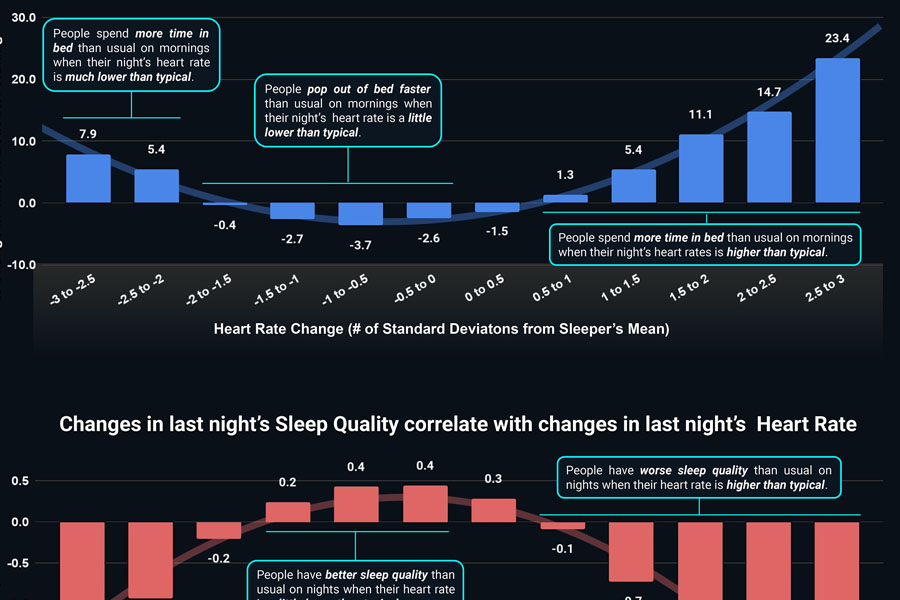
Arousal Index & Light Sleep: The Subtle Connection
-
There's a weak positive correlation between your arousal index (micro-awakes per hour) and light sleep minutes.
- When your light sleep is higher, your arousal index tends to be slightly higher too.
- For Example, with high light sleep, your arousal index averages around 16; with low light sleep, it's about 15.
- This means more light sleep might come with a few more micro-awakenings, but the effect is minor.
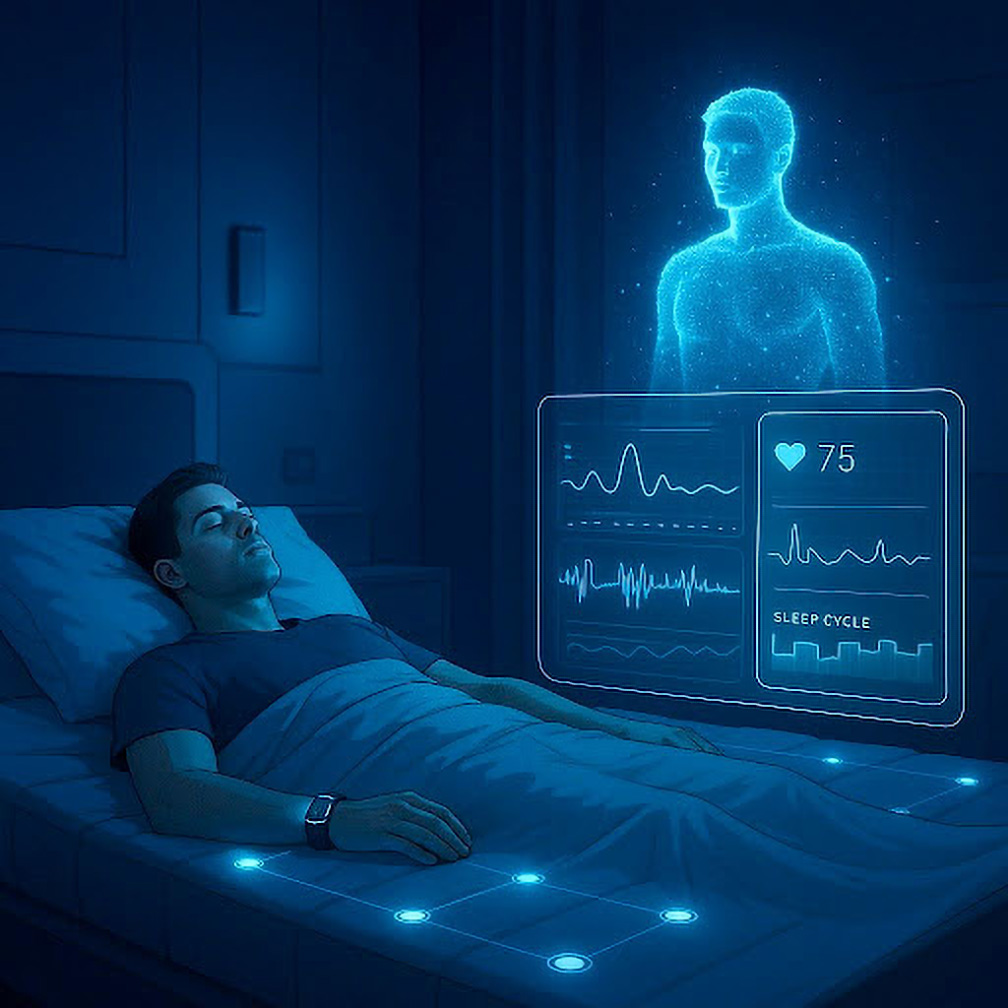
Empowering Health Through Digital Twins: Real-Time Biosensing for Optimized Sleep and Health
At the forefront of digital transformation, Fullpower-AI has long demonstrated clear leadership in the development and deployment of digital twin technology—well before the concept became widely recognized across industries.
Our patented innovations leverage real-time biosensing to create dynamic digital replicas of users and their environments, advancing health and wellness far beyond traditional passive monitoring. By integrating advanced sensors, intelligent algorithms, and adaptive sleep systems, our digital twins not only track and analyze vital health metrics but also proactively optimize conditions for rest, recovery, and performance.
From personalized sleep optimization to continuous, real-time modeling of daily behavior and environment, Fullpower-AI’s pioneering work has set the industry standard. As digital twin ecosystems continue to reshape our world, we are proud to empower individuals with actionable insights and intelligent automation—making every day healthier and more productive.
The Fullpower-AI KOA Digital Twin Platform provides a data-driven, real-time virtual model of individual physiological and behavioral states, integrating high-fidelity biosensing and artificial intelligence to advance precision health and wellness management.
Scientific Principles of the Fullpower-AI KOA Digital Twin Platform
Continuous Data Integration: The platform collects and fuses real-time data streams from a comprehensive array of wearables and biosensors, allowing for a multidimensional assessment of physiological parameters, including sleep, activity, and vital signs.Personalized Simulation and Prediction: Using advanced machine learning algorithms, Fullpower-AI's digital twins generate individualized predictions to inform proactive health interventions, risk stratification, and treatment optimization.
Dynamic, Adaptive Modeling: The digital twin adapts in real time as patient data updates, improving the accuracy of outcome modeling and enabling rapid adjustment of recommendations and care pathways.
No-Code and API Flexibility: Researchers and clinicians can implement models and adjust system parameters through user-friendly no-code interfaces or integrate with external systems using robust APIs for custom analytic pipelines and studies.
Applications in Medicine, Health, and Wellness
Patient Monitoring: Enables continuous, remote assessment of health status, supporting early detection of adverse events and chronic disease management.
Intervention Optimization: Simulates outcomes of lifestyle or therapeutic interventions, facilitating evidence-based personalization of treatment and preventive care plans.
Data-Driven Research: Aggregated, anonymized digital twin data supports large-scale studies on sleep, recovery, and wellness, contributing to new insights in precision medicine and public health.
By combining real-time biosensing, AI-driven prediction, and adaptive modeling, the Fullpower-AI KOA Digital Twin Platform advances the scientific foundation for personalized, preventive, and participatory health and wellness care.
The Sleeptracker-AI SaaS platform provides valuable insights and tools for clinical trials, scientific research, and benefits a wide range of healthcare practitioners.
Sleep medicine: Ideal for assisting in the management of a range of sleep disorders.
Primary care: Helpful for monitoring sleep-related issues in patients with chronic conditions.
Longevity: Quality sleep is emerging as a crucial predictor of longevity.
Pulmonology: Useful for managing respiratory conditions and breathing-related sleep disorders.
Cardiology: Beneficial for tracking sleep disturbances correlated to cardiovascular health.
Neurology: Supports the assessment of neurological impacts of sleep disorders.
Psychiatry and psychology: Valuable for tracking the relationship between sleep and mental health conditions.
Endocrinology: Helps to monitor sleep's impact on metabolic disorders.
Sports medicine: Provides insights into athletes' sleep to optimize recovery and performance.
Age-Tech: Helps manage sleep issues in elderly patients, as sleep disorders can affect overall health and quality of life.
Behavioral sleep science: Supports cognitive-behavioral changes with continuous, detailed data.
Pediatrics: Assists in monitoring sleep in children and adolescents with developmental or sleep-related issues.
Obstetrics and gynecology: Potentially helpful in tracking sleep disturbances in pregnant patients or during menopause, where sleep can significantly impact overall health.

The Sleeptracker-AI SaaS platform developed by Fullpower-AI provides contactless remote in-home sleep monitoring for patients and real-time analytics with detailed no-code dashboard tools for clinical trials and practitioners. It also provides a real-time API for cloud-to-cloud integration.
Stanford Sleep Medicine and UCSF have vetted the system, ensuring high accuracy comparable to gold-standard polysomnography. The Sleeptracker-AI platform enhances patient care by offering the following benefits:
Completely noninvasive and contactless
There is nothing to wear or charge. It is invisible under any mattress and integrates environmental sensing to monitor breathing air quality and correlate it to sleep.
Early detection of issues
Remote monitoring with Sleeptracker-AI allows practitioners to identify sleep patterns or breathing disturbances before symptoms worsen.
Continuous monitoring
Sleeptracker-AI provides real-time and long-term data, offering a more comprehensive understanding of the patient's condition than periodic in-person visits and a retrospective perspective.
Improved treatment adjustments
Practitioners can adjust treatment plans based on continuous data from Sleeptracker-AI, changing medications, devices, or therapies as needed, improving patient outcomes.
Convenience for patients
Sleeptracker-AI eliminates the need for frequent in-person visits, which can be time-consuming or difficult for patients with mobility issues or living in remote locations.
Enhanced patient compliance
Patients are more likely to comply with prescribed treatments and follow up on care when they know their condition is continuously monitored.
Data-driven insights
Sleeptracker-AI provides practitioners with objective data, reducing reliance on subjective patient reports and enabling more accurate diagnosis and treatment.
Timely intervention
Practitioners can intervene promptly if critical signs, such as severe sleep disturbance episodes, are detected.
Cost-effective
Sleeptracker-AI reduces healthcare costs by minimizing the need for overnight sleep studies or hospital stays for monitoring purposes.
Patient empowerment
Patients can actively participate in their care by viewing their data and understanding their condition, leading to better engagement and lifestyle changes.
Expert deployment: Anil Rama, MD, a board-certified sleep physician, is deploying this new service at "Sleep and Brain, Powered by Sleeptracker-AI," ensuring expert care and oversight.
Integrations
Including Apple Health, Apple Watch, Pixel Watches, Samsung Watches, and Android Health Connect.
Fullpower-AI's generative AI and deep learning solutions empower sleep clinics to deliver expert, continuous care and oversight for their patients. The Sleep and Brain Clinic utilizes the Sleeptracker-AI platform, which provides real-time, contactless monitoring and analytics through an advanced dashboard. This system enables clinicians to remotely track sleep stages, detect sleep disorders, and receive timely alerts for critical events, all with accuracy validated by leading institutions such as Stanford Sleep Medicine and UCSF.

Case Study: COPD Care With Real-Time Response
Visit AnsibleHeath and Fullpower-AI® for information on this partnership.
Sleep research, science, and medicine are our focus. We support three successful business models: CRO, B2B Licensing, and PaaS.
Sleeptracker-AI: The Perfect Complement For Wearables
100% Contactless and Non-invasive
Contactless biosensing and non-invasive offers improved compliance, convenience, comfort, and user retention compared to wearables by eliminating the need for physical contact, charging, allowing monitoring of multiple sleepers without restrictions, and reducing issues related to device abandonment.
Automatic and Invisible: 100% compliance every night
Contactless Sleeptracker-AI eliminates the need for individuals to consistently wear or interact with devices, improving compliance rates and data collection consistency.
Always on, always connected, no need to recharge
Eliminates the need for users to wear, maintain, or charge devices, allowing for continuous monitoring without interruptions or user intervention.
Real-time with configurable notifications and event alerts of sleep disorders
Automatically continuously monitor sleep patterns without physical contact, allowing for immediate detection and customizable alerts for sleep disturbances without the discomfort or limitations of wearing a device.
Real-time API for cloud-integration integration with existing systems and wearables
Integrate directly with clinical trial platforms, research projects, patient monitoring in real-time.
Environmental sensing with sleep correlations
Simultaneously monitoring the bedroom environment while conducting sleep analysis allows researchers to directly correlate environmental factors such as temperature, humidity, noise, levels with sleep quality, duration, and disturbances, providing valuable insights into how specific environmental conditions impact sleep patterns and overall sleep health.
Monitors two sleepers simultaneously with potential interactions including sleep disorders such as snoring, apnea, and wake-ups
The data shows that two out of three beds have two sleepers. For the first time, two sleepers can be monitored and correlated to measure some of the effects of one sleeper on the other and build meaningful models.
Clinically Validated
The Sleeptracker-AI® SaaS platform is validated in clinical studies with Stanford University, Division of Sleep Medicine, and UCSF
Clinical Trials and Research
Sleep is one-third of patients' lives and an important component in clinical trials and research
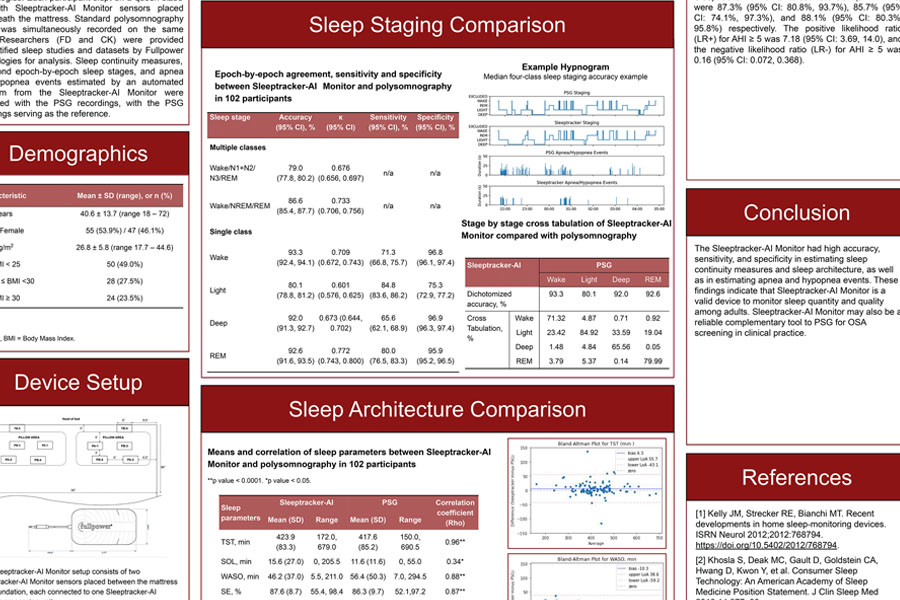
Polysomnographic validation of the Sleeptracker-AI® solution in estimating sleep architecture and obstructive sleep apnea in adults, in collaboration with Stanford Sleep Medicine, as presented by Dr. Clete Kushida at the 2022 Sleep World Congress in Rome (Italy).

Featured in Sleep Medicine
Volume 96, August 2022, Pages 20-27
Highlights
- An under-mattress sleep monitoring device (Sleeptracker-AI Monitor) was compared with polysomnography (PSG).
- Sleeptracker-AI Monitor estimated comparable sleep measures and had high agreement in sleep stage classification with PSG.
- Sleeptracker-AI Monitor had high accuracy in estimating obstructive sleep apnea.
Reference: Ding, F., Cotton-Clay, A., Fava, L., Easwar, V., Kinsolving, A., Kahn, P., Rama, A., & Kushida, C. (2022). Polysomnographic validation of an under-mattress monitoring device in estimating sleep architecture and obstructive sleep apnea in adults.Sleep medicine, 96, 20-27.
Stanford validated and Peer-Reviewed
Read the entire publication at Science Direct:
https://www.sciencedirect.com/science/article/pii/S1389945722001368
Estimated Sleep-Wake Patterns Obtained From a Large U.S. Sample Using a Home-Based Under-Mattress Sleep-Monitoring Device

Featured in the Journal of Sleep Medicine
Volume 21(3), December 31, 2024
Highlights
- Recordings were obtained using an under-mattress sleep monitoring device (Sleeptracker-AI Monitor).
- Sleeptracker-AI Monitor estimated comparable sleep measures and had high agreement in sleep stage classification with PSG.
Obstructive Sleep Apnea Detection and Prevalence in Men and Women Using a Continuous Large U.S. Sample by Home Under-Mattress Devices
Featured in
Sleep Medicine Online, September 16 2025
Highlights
- The prevalence of OSA is influenced by gender and age.
- Single-night sleep study may inaccurately classify OSA severity due to night-to-night variation.
- Home-based continuous sleep monitoring devices have the potential to enhance OSA diagnosis and address night-to-night variability.
- Sleeptracker-AI Monitor exhibits high sensitivity and specificity in diagnosing OSA during extended periods of continuous monitoring.
Reference: Wanchaitanawong, J., Cotton-Clay, A., Baron, S., Fava, L., Easwar, V., Kinsolving, A., Zitser J., Leng, Y., Kahn, P., & Kushida, C. (2025)
Stanford validated and Peer-Reviewed
Read the entire publication at Science Direct:
https://www.sciencedirect.com/science/article/abs/pii/S1389945725004836
70+ Very Large Dataset Sleep Studies Powered by ML and AI Analytics
Real-Time No-Code Dashboard Tools
Remotely monitor in real-time patients or all trial subjects with event alerts and notifications. This includes remote real-time vital signs, respiratory events, and sleep patterns of patients.Complete Integrated Machine Learning Modeling Tools With a Complete Set of AI-powered Analytical Tools
Supports supervised and unsupervised learning, deep-analysis, and infographics with statistical backing.AI-powered, Highly Accurate
Exceeds 90% accuracy of gold-standard Polysomnography in many key metrics. Large anonymized dataset of demographically diverse subjects ideal for use as a statistical reference to back trials and remote monitoring.135+ Patents, 10+ Years Of Sleep-Science And AI Leadership
Spanning AI, Machine Learning, Biosensing, Health, Cognitive Behavioral Science, Sleep Science, and more.Two Sleepers With Correlations in Real-Time
The data shows that two out of three beds have two sleepers. For the first time, two sleepers can be monitored and correlated to measure some of the effects of one sleeper on the other and build meaningful models.Built-in Environmental Sensing with Sleep Quality Correlations
The data shows that the room environment, including air temperature, air quality, and humidity, correlates to sleep quality.Recent Dataset Studies
How the 4/2/26 Bay Area Earthquake Impacted Sleep Patterns
Our fullpower.com Data Science KOA analysis of our strong shaker!
Seismic Sleep Disruption: Analysis of the Boulder Creek Earthquake
The April 2 earthquake near Boulder Creek served as a compelling natural experiment for the Fullpower® Sleeptracker-AI® platform, offering a high-resolution look at how seismic events disrupt human rest.
Key Findings from the Dataset
The data revealed a sharp, synchronized spike in wakefulness across the region the moment the tremors began. Here is the breakdown of the observations:
* Zero Premonition: The signal was instantaneous. Analysis of the pre-quake data showed no measurable changes in heart rate or movement that would suggest "earthquake anticipation" or subconscious sensitivity prior to the event.
* The "Epicenter Effect: While the entire region woke up at 1:41 a.m., the recovery phase, the time taken to return to sleep, varied significantly.
* Proximity vs Persistance: There was a direct correlation between geographic proximity to the epicenter and the duration of wakefulness. The closer a sleeper was to the source, the more difficult it was to achieve sleep onset latency (falling back asleep).
Event Specifications
The Takeaway: This event confirms that earthquakes don't just wake us up; they create a lingering physiological "echo." The data suggests that the intensity of the physical experience dictates the duration of the subsequent sympathetic nervous system arousal, making the return to sleep a function of distance from the source.
![]()
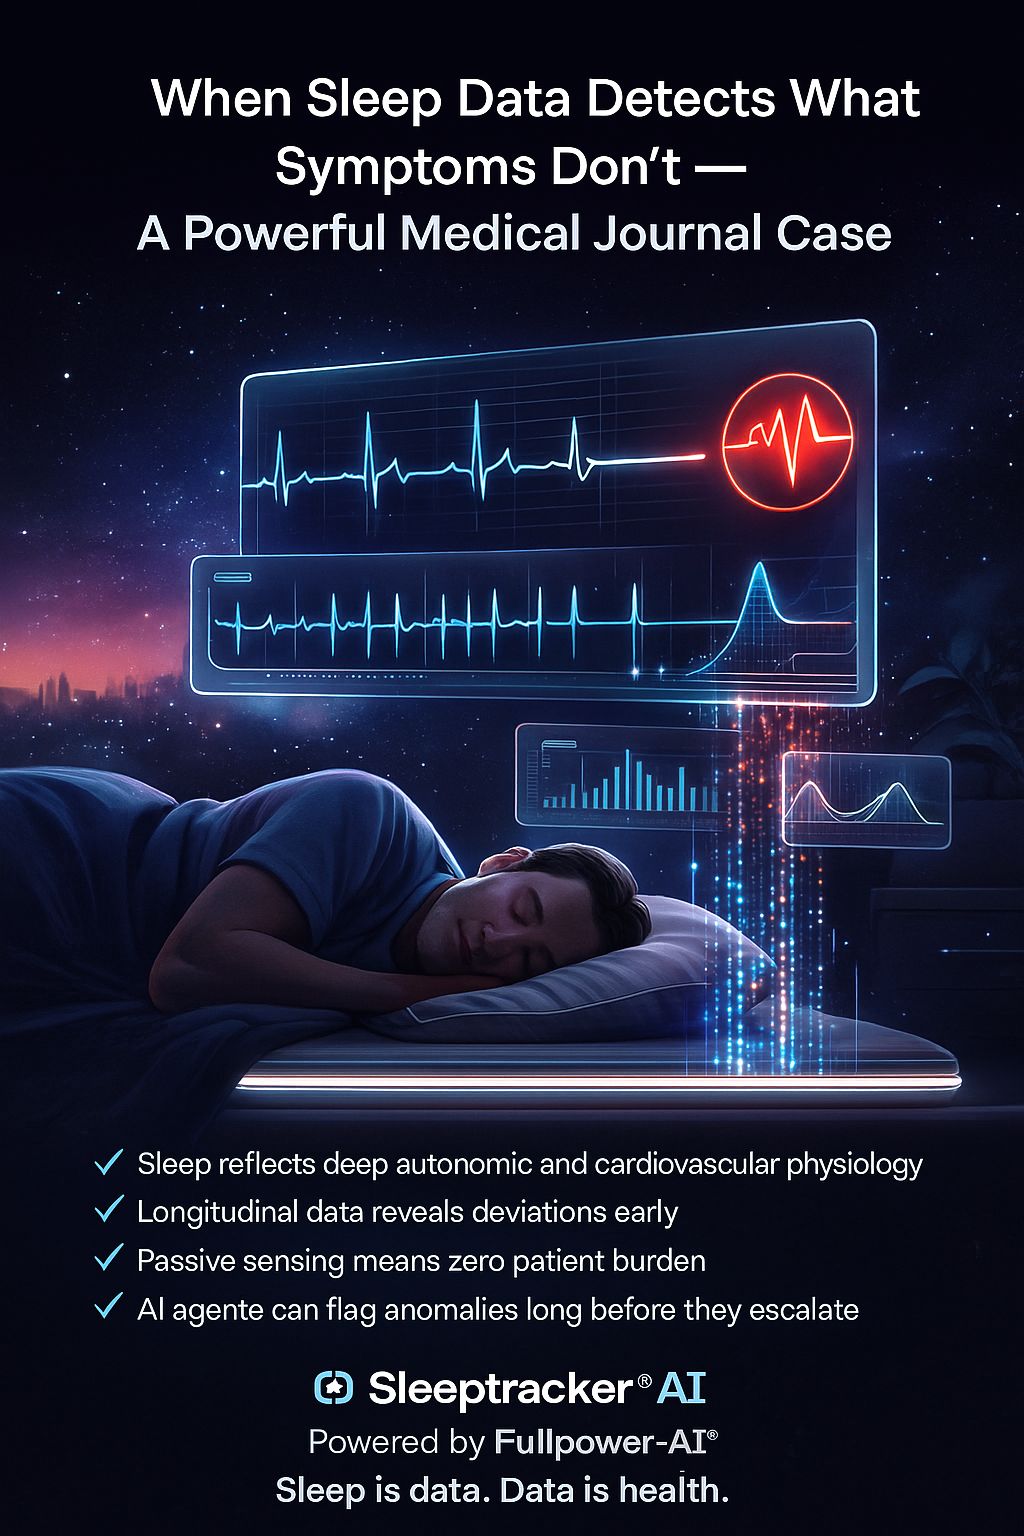
When Sleep Data Detects What Symptoms Don’t — A Landmark NEJM Case
A powerful clinical case published this week in The New England Journal of Medicine highlights something extraordinary:
A patient’s complete heart block — a life-threatening condition — was first detected at home, during sleep, by a Sleeptracker-AI–powered TEMPUR® smart Bed using KOA, the Sleep-Science Agent. Try Koa: https://koa.fullpower.ai/
- Before symptoms.
- Before awareness.
- Before a crisis.
This is exactly why we built Sleeptracker®-AI and KOA.
Our under-mattress biosensing platform captures continuous, high-resolution physiological signals — completely passively — and KOA interprets patterns in autonomic and cardiovascular function that humans simply cannot see in daily life.
Why This Matters for Healthcare and Consumers in General:
- Sleep is a window into autonomic + cardiovascular physiology
- Longitudinal data exposes deviations early
- Passive sensing = zero sleeper burden
- The Koa AI agent can flag anomalies long before they escalate
Sleeptracker-AI has already been peer-reviewed and validated by Stanford Sleep Medicine against PSG for sleep staging, sleep continuity, and cardiorespiratory monitoring.
This NEJM case reinforces what continuous, real-world biosensing makes possible.
Sleep is not just restorative.
It’s a clear, objective signpost for health.
And sometimes — it’s lifesaving.
Sleeptracker®-AI | Powered by KOA | Fullpower-AI®
www.fullpower.com
Sleep is information. Information is health.
Link to the NEJM case:
https://www.nejm.org/doi/full/10.1056/NEJMicm2510111
![]()
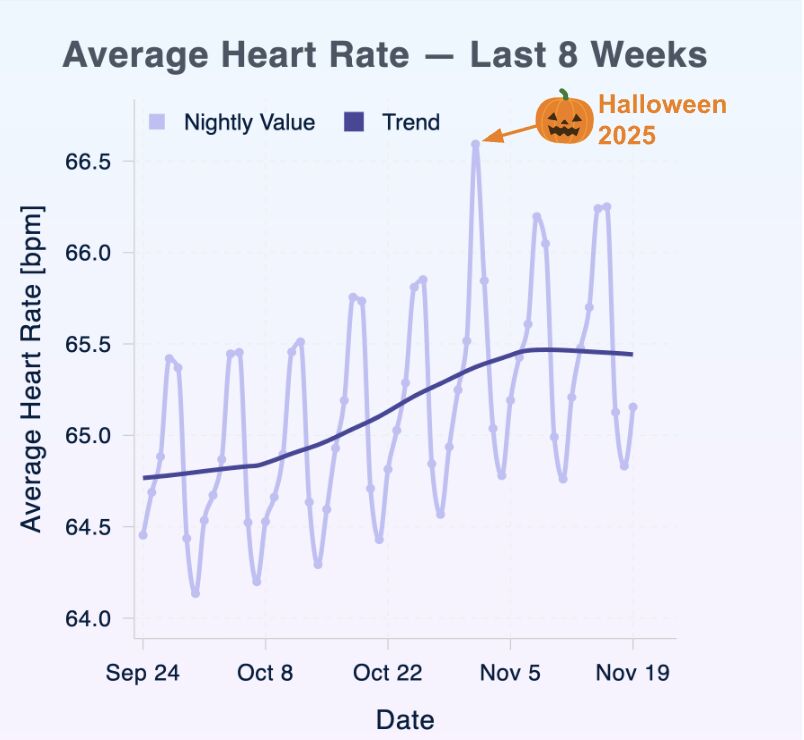
New Koa Research Sleep-Science Agent! Halloween as a Case Study
Every night, Sleeptracker-AI® analyzes millions of fully anonymized sleep recordings.
This Halloween, our data showed something striking: a clear spike in resting heart rate across sleepers in the U.S.
The cause is clear: Behavioral changes that activate the sympathetic “fight-or-flight” response, which our sensors capture at population scale:
- Increased sugar intake
- Higher alcohol consumption
- Later bedtimes
- Nervous-system stimulation
The Fall Effect: Beyond a single holiday, we observe a steady, seasonal rise in RHR. Colder weather, shorter days, and routine shifts subtly stress the cardiovascular system throughout the fall.
Sleep data reveals how we live. Sleep is health, and often, it’s a great story.
Do your own research with our Koa Sleep-Science agent. Leverage our dataset of 250 million nights of sleep to explore trends in recovery, activity, or lifestyle shifts—especially during the holiday season.
---> Access the Koa Agent:
https://koa.fullpower.ai/
Make your very own sleep-science prompts!
https://www.fullpower.com/
![]()
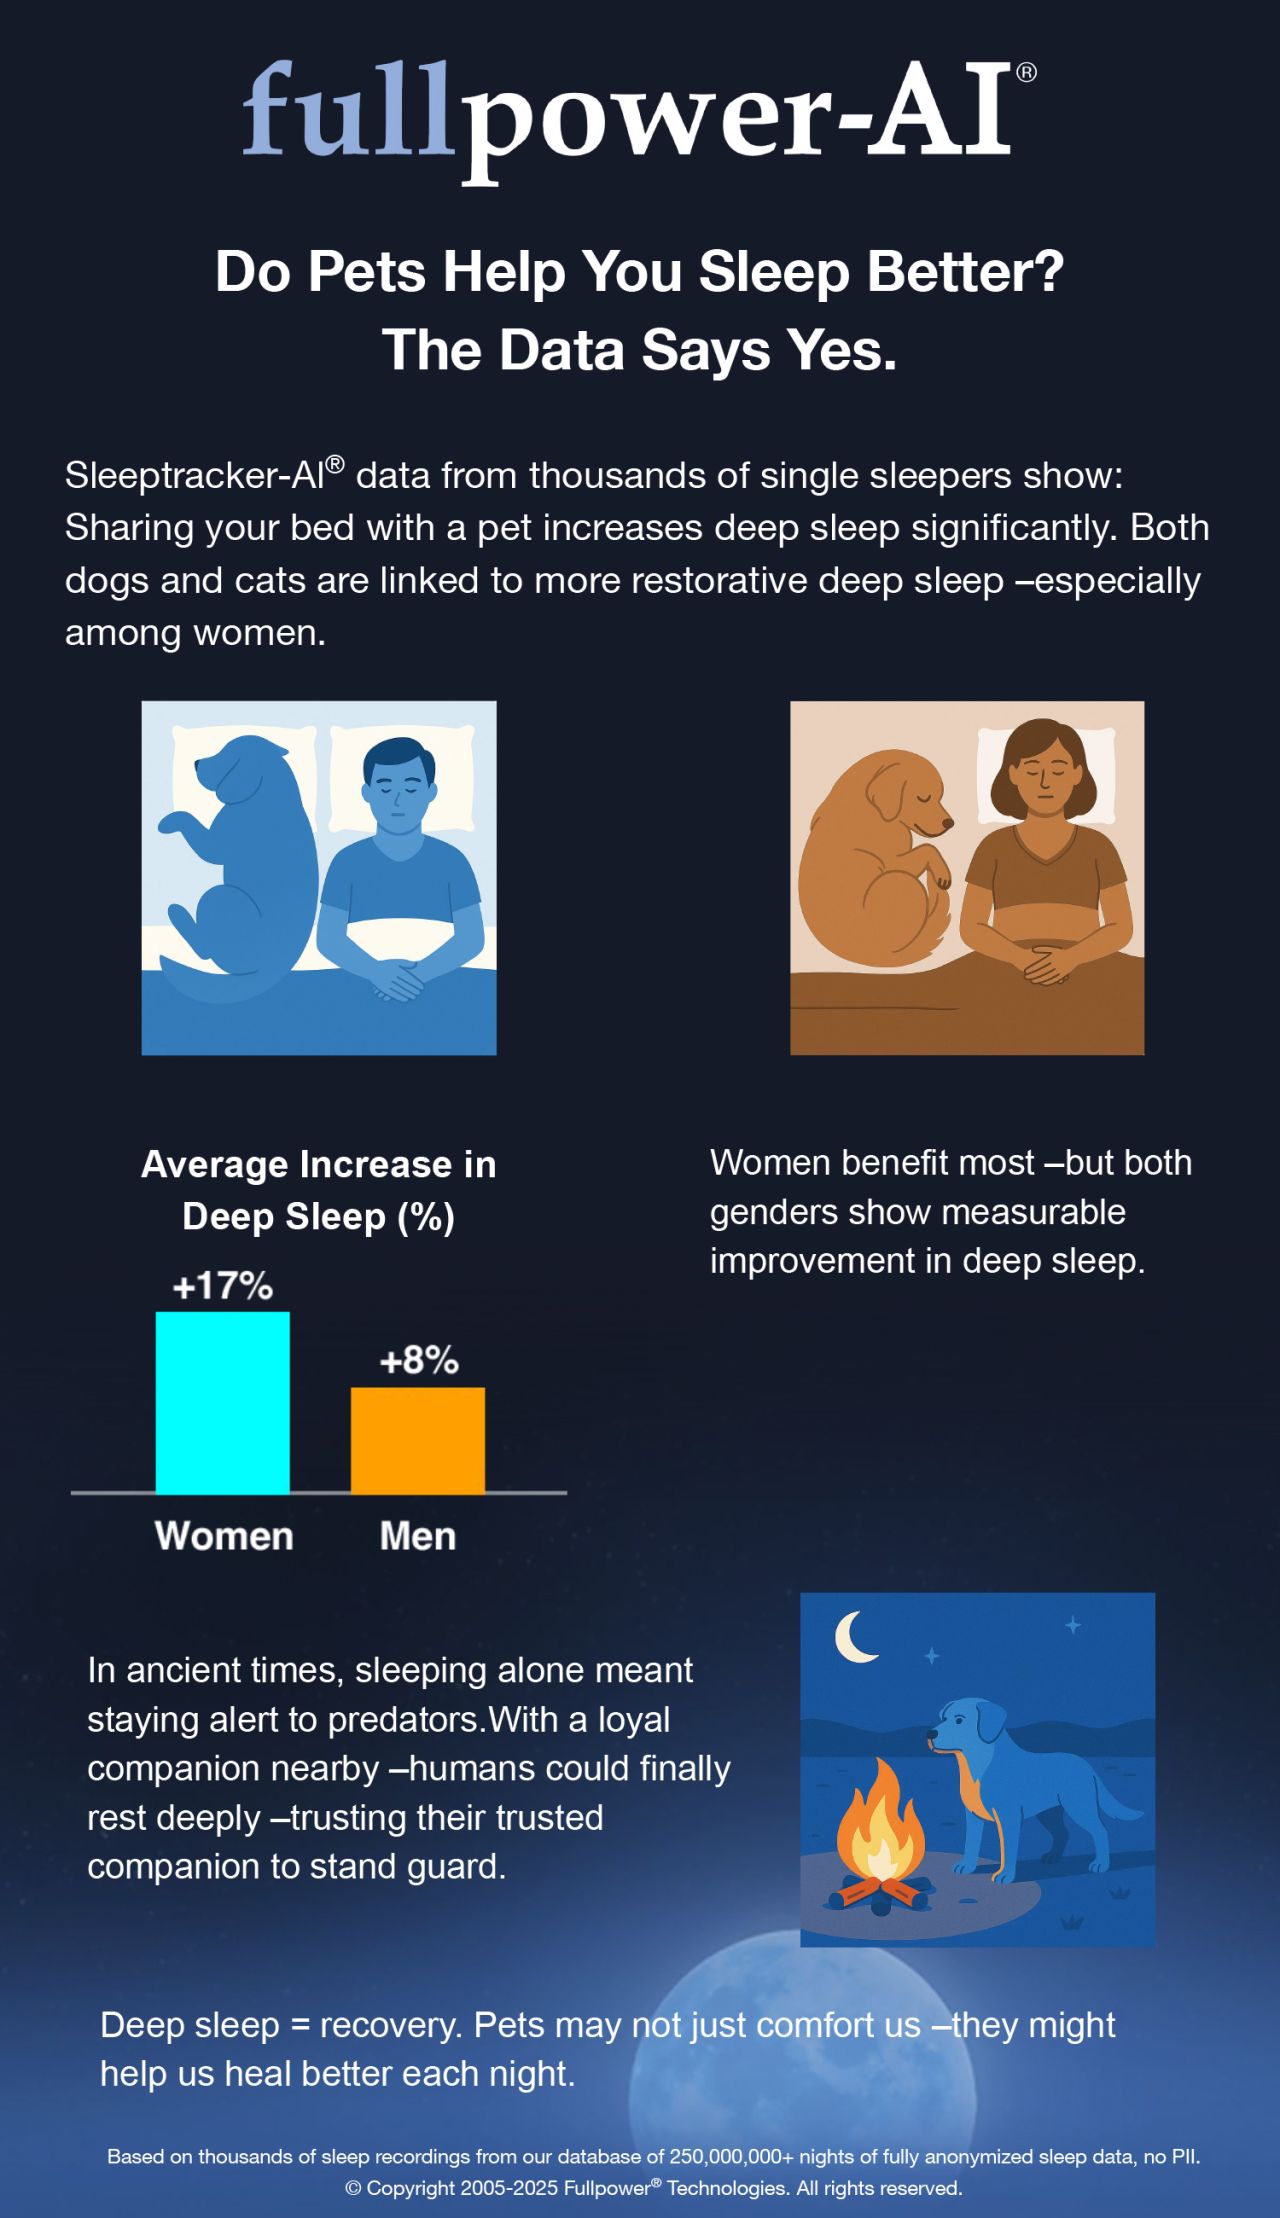
Want More Deep Sleep? Live with a Dog or Cat!
Deep sleep is when the body rebuilds, repairs, and strengthens the immune system. Our data confirm what many have long suspected — pets may be good for our sleep. In fact, sharing the bed with a pet is associated with a significant increase in deep sleep.
This finding challenges some “opinion-based sleep advice” suggesting that pets disrupt rest. The Sleeptracker-AI dataset, drawn from a large population of single users, tells a different story: living with pets often enhances the quality of deep sleep. Women, in particular, appear to benefit even more than men, and the effect is consistent for both dogs and cats.
There may even be an evolutionary explanation. In prehistoric times, solitary humans had to stay alert throughout the night, listening for predators such as cave bears or saber-toothed tigers. With a canine companion standing guard, it would have been safer to let down one’s guard — and sleep more deeply. That ancient sense of trust and safety may still linger today, helping us rest more soundly beside our trusted furry friends.
![]()
Contact Information and Headquarters
Silicon Valley
Fullpower Technologies, Inc.1200 Pacific Avenue, Suite 300
Santa Cruz, CA 95060
USA


Fullpower-AI is the developer of the Sleeptracker-AI platform
Our mission is to make advanced AI biosensing universally accessible, empowering better sleep, Remote Patient Monitoring (RPM), and healthspan through real-time, science-validated intelligence. Fullpower-AI® delivers real-time, science-based biosensing and generative AI SaaS platforms—validated with Stanford Medicine and UCSF and deployed globally under long-term commercial licenses. Each platform transforms continuous, contactless sensing into actionable health intelligence.
Visit Fullpower-AI
Sleep research, science, and medicine are our focus. We support three successful business models: CRO, B2B Licensing, and PaaS.